Few screenshots of the final Report
Business Request
Email from Sales Management…………..
Subject: Request for Assistance: Enhancing Internet Sales Reports with Power BI Dashboard
Hi there,
Hope you are doing great. We need to improve our internet sales reports and find a better way to represent business data to provide more insightful representation. So, I was wondering if you can help to build a power BI dashboard that will primarily focus on key business metrics such as sales revenue, profit, gross margin and detailed product information. I have attached all the necessary files that you need to build the dashboard.
Please do not hesitate to reach out to me with any further queries.
Regards,
Chris Martin
Sales Manager
Business Request Breakdown
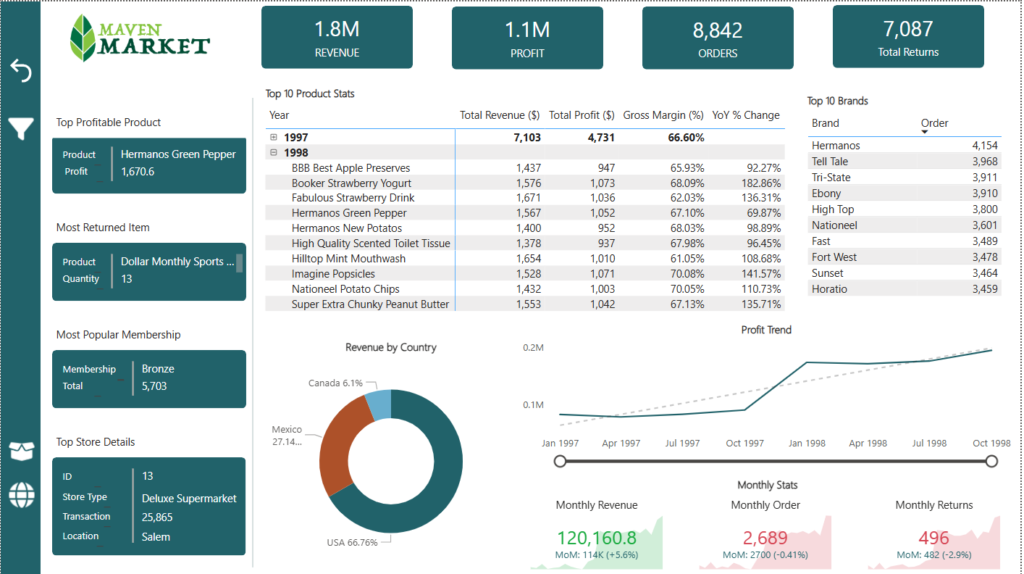
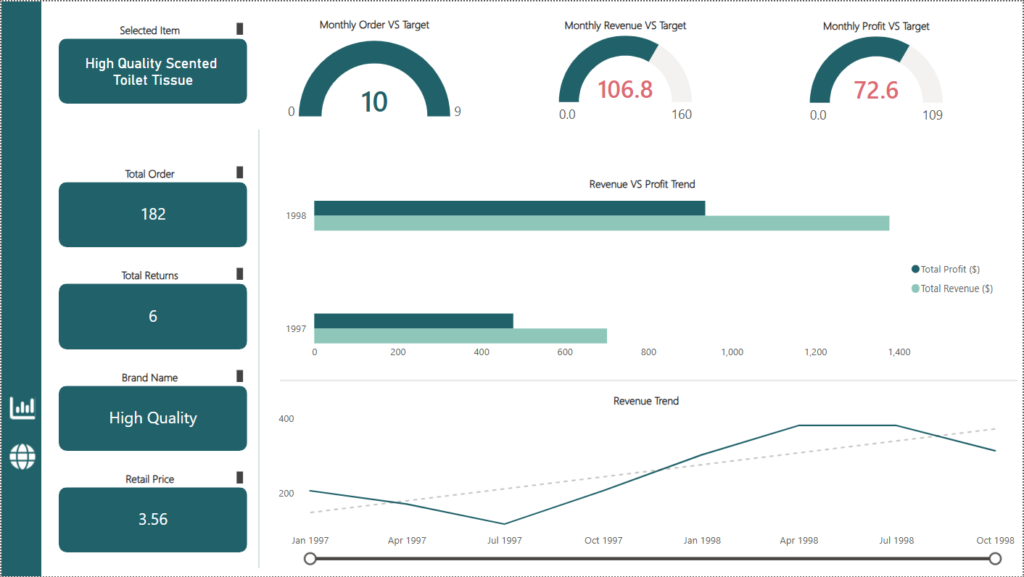
Based on the request, I decided to create a three-page report. The Dashboard page focuses on overall business stats (KPIs), the Product Details page provides in-depth information about individual products, and the Map page visualizes total revenue and profit by region.
Below is the layout of the dashboard report
| Dashboard | Product Details |
| A quick overview of overall sales – overall revenue, profit, and YoY etc. A comprehensive overview of overall sales – Detailed information about top products, profit, and revenue trend and so on. | A quick overview of individual product – total amount sold, brand details, price details, total return etc. A detailed overview of individual product – monthly sale stats, overall sales trend etc. |
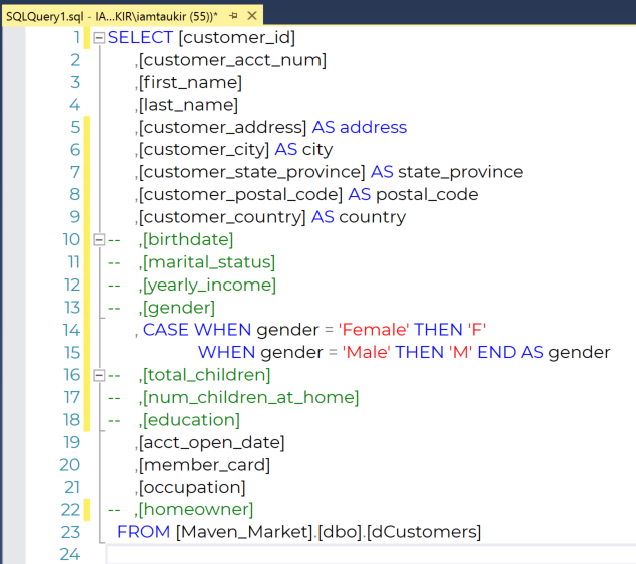
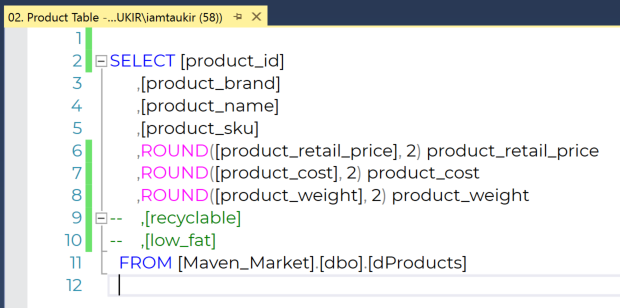
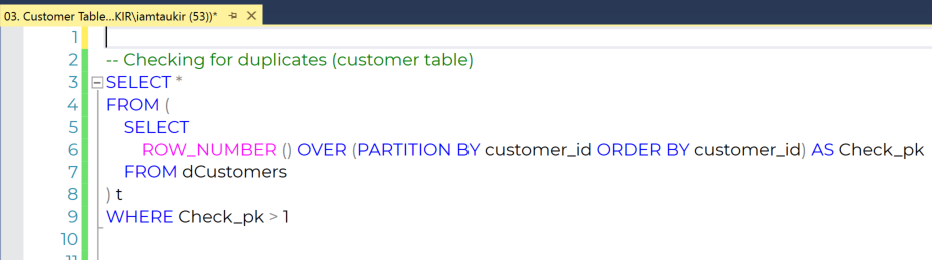
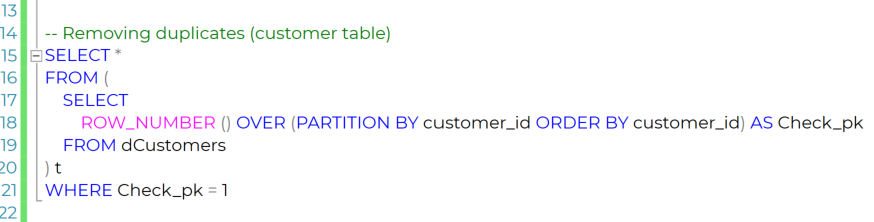
Step 1 – Data Cleaning in SQL
I began my project by cleaning the data in SQL Server. After importing all the CSV files into SQL Server, I filtered out unnecessary columns and wrote SQL queries to remove duplicates and address any discrepancies.
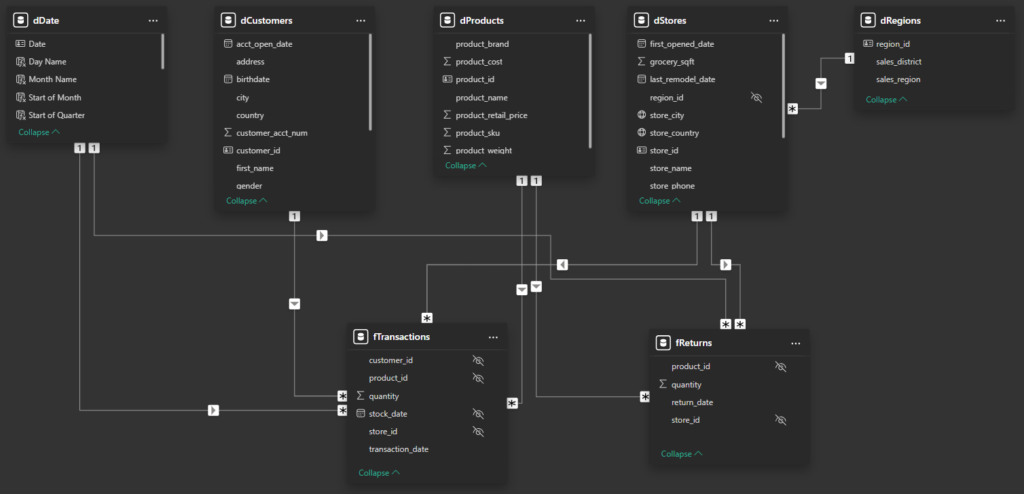
Step 2 – Importing Files and Creating the Data Model in Power BI
After completing the data cleansing in SQL Server, I used Power Query to import the dataset into Power BI. I then established the necessary relationships between the tables to build a robust data model.
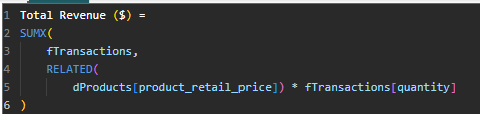
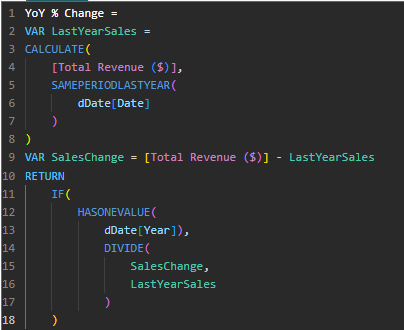
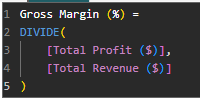
Step 3 – Calculations in DAX
Step 4 – Building Dashboard on Power BI
After building the data model, I designed the layout for the dashboard. I then created various DAX measures for calculations and developed the dashboard to highlight the key metrics of the business.
Here is the live version of the report. Check it out……….