Few screenshot of the final Report
Business Request
Email from Sales Management…………..
Subject: Request for Assistance: Product sales overview with Power BI Dashboard
Hi there,
Hope you are doing great. We want to get a customized bike sales report to get a clear idea about sales trend for the different items we carry. So, I was wondering if you can help to build a power BI dashboard that will primarily focus on key business metrics such as sales revenue, refunds, and detailed product information by category. I have attached all the necessary files that you need to build the dashboard. Your focus should be on product sales and refund trend.
Please do not hesitate to reach out to me with any further queries.
Regards,
Chris Martin Sales Manager
Business Request Breakdown
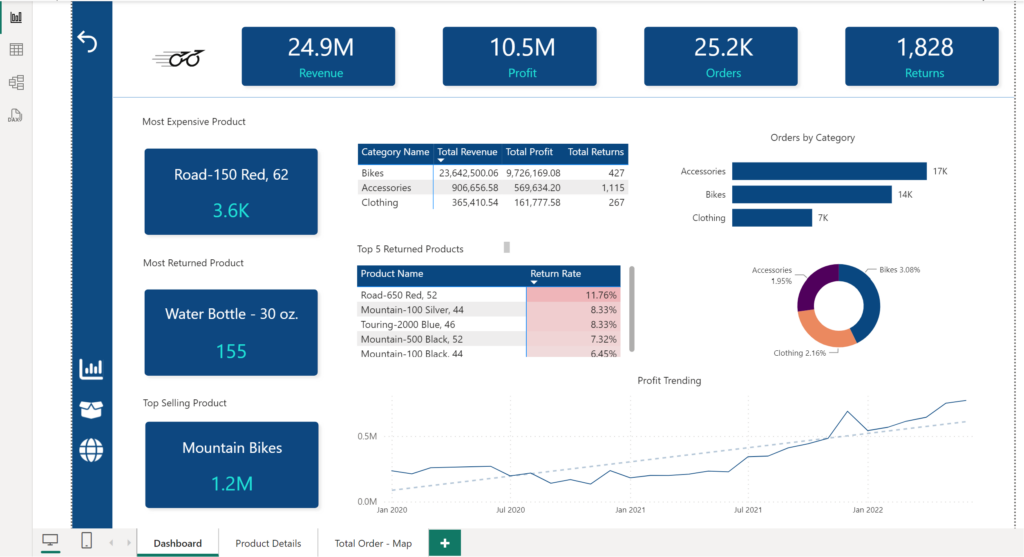
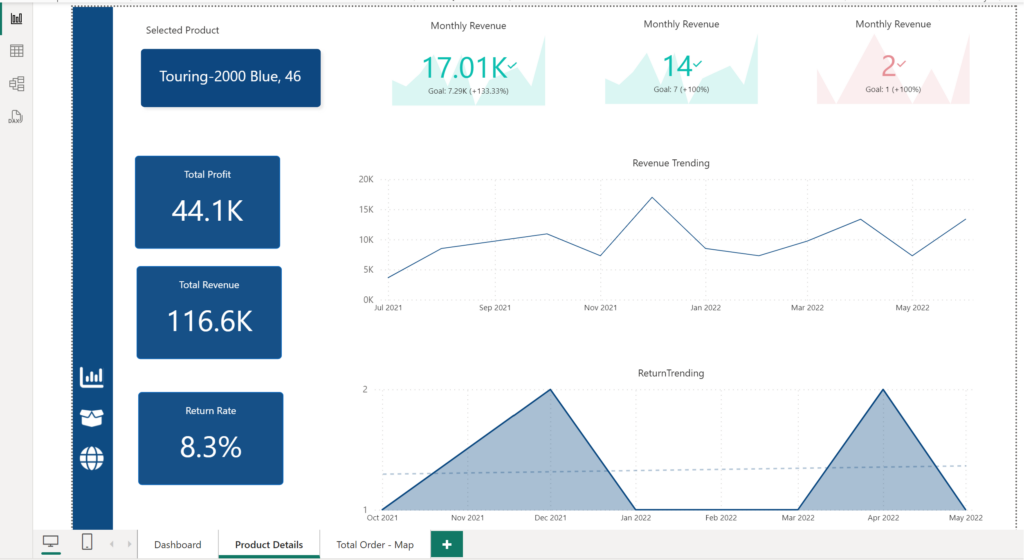
Based on the request above, I decided to create a three-page report. Dashboard page will focus on overall sales and refund stats, product details page will focus on detailed information about individual product and total order- map page will focus on sale trends by different regions.
Below is the layout of the dashboard
| Dashboard | Product Details | Total Order |
| A quick overview of overall sales. Overall revenue, profit, and refunds A detailed overview of overall sales Detailed information about top selling products, most returned products and so on. | A quick overview of individual products. Monthly sale stats, overall trends etc. A detailed overview of individual product Total Profit, total revenue, return rate and so on. | A quick overview of: Product Sale trends by different regions |
Step 1 – Data Cleaning in Excel
I began my project by cleansing the data. After importing all the files into SQL server, I filtered out unnecessary columns and wrote necessary SQL codes to extract insightful business data. Below are the SQL statements for cleansing and transforming the necessary data.
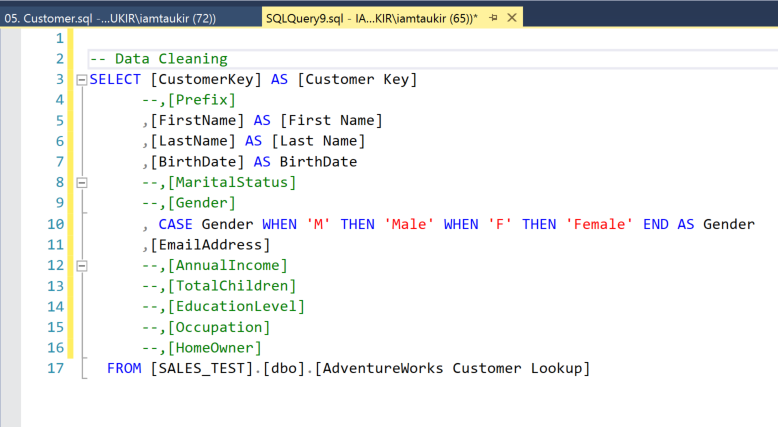
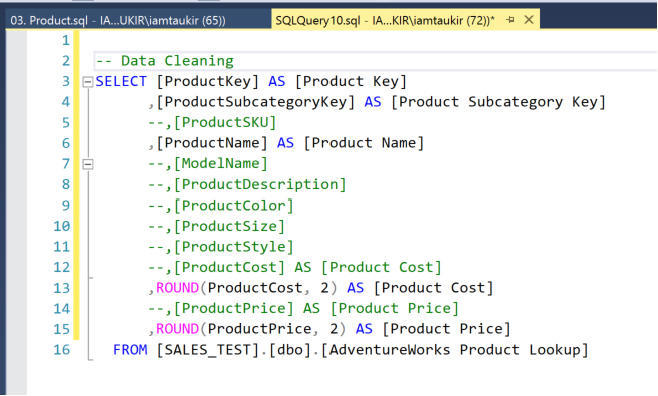
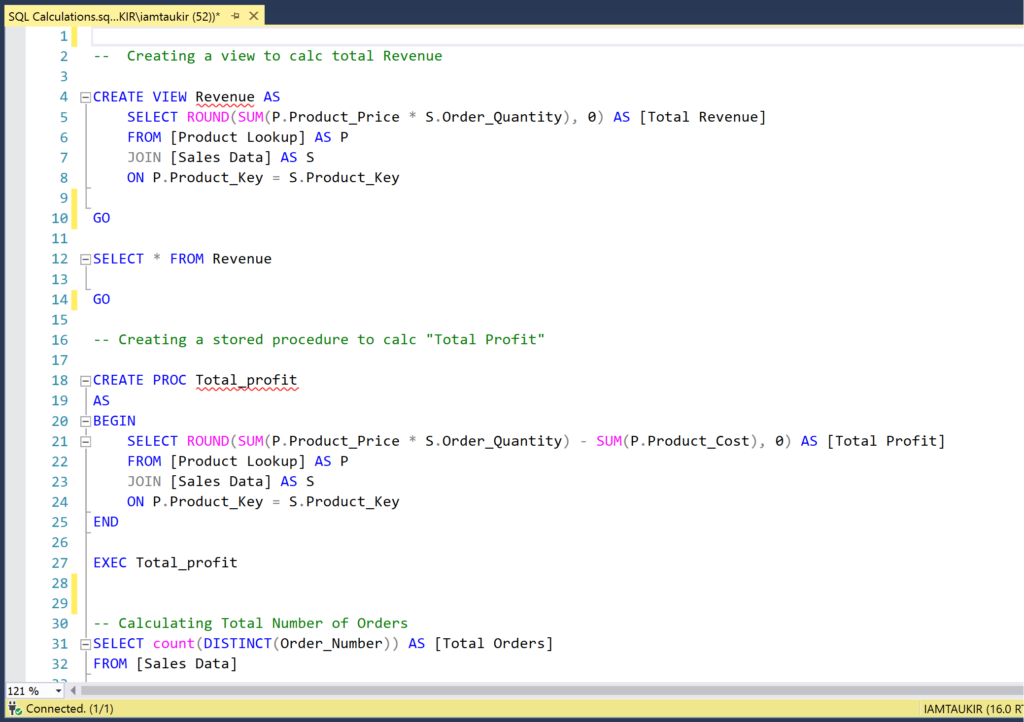
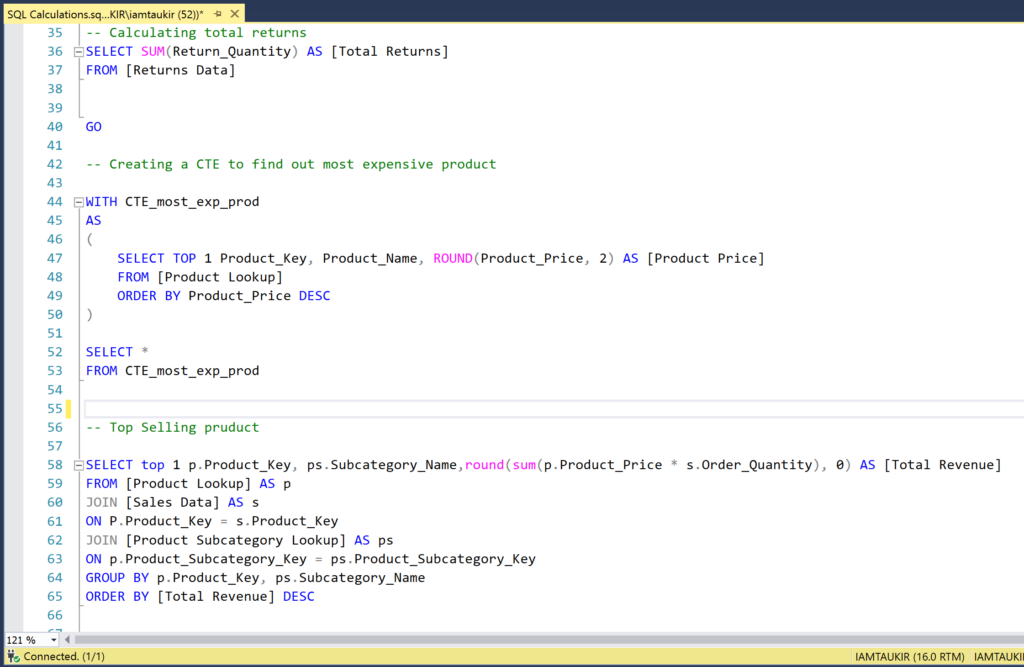
Calculations in SQL
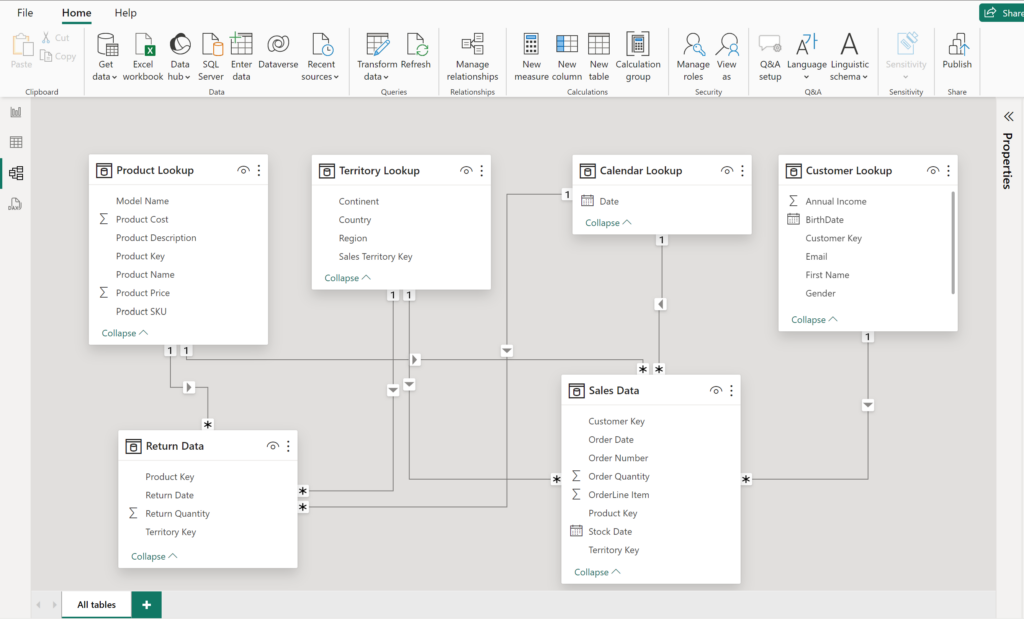
Step 2 – Importing files and creating “Data Model” on Power BI
Following the completion of data cleansing on the SQL server, I imported those files into power BI and built necessary relationships between tables to create a robust data model. Subsequently, I wrote few DAX codes to obtain deeper insights into the sales and refund data.
Step 3 – Building Dashboard on Power BI
After completing the calculations, I created a layout for the dashboard and started building my report.
Check out the live version of the report